Apartment List Renter Migration Report: 2022 Q1
Welcome to Apartment List’s quarterly Renter Migration Report. In this report, we analyze data on millions of searches to see where our users are preparing to move, shedding new light on the migration patterns of America’s renters. This quarter’s report incorporates the search preferences of users who registered with Apartment List between January 1 and March 31, 2022.
Over the course of the past year, rent increases have hit virtually all corners of the nation. Nationally, the median rent price is up 16 percent year-over-year, and in some cities rent growth is more than double that. Renters who are apartment hunting now must contend with this affordability crunch as well as a competitive rental market with historically low vacancy rates. Renter migration has also been impacted by one of the most significant societal shifts brought about by the COVID pandemic, the widespread adoption of remote work, which has allowed some workers to pursue longer-distance moves. In the first quarter of 2022, 40 percent of Apartment List users were searching to move to a new metropolitan area and 27 percent were searching in a different state altogether. Below we highlight some emergent migration trends that are taking place in our marketplace which could signal a shift in where the nation’s renters live in the near future.
Technology centers are emerging as “revolving door” metros
For any given metropolitan area, our analysis considers “outbound” and “inbound” searches:
- Outbound searches are all searches performed by users who live in that metro, regardless of where the user is searching. Outbound searches from a metro can be for the same metro or a different metro.
- Inbound searches are all searches for apartments within the metro, regardless of where the user lives. Again, inbound searches can be from the same metro or a different metro.
The table below shows the metros with the highest share of cross-metro outbound and inbound search activity. On the left are the ten metros with the largest share of residents who are looking to move somewhere new, and on the right are the ten metros with the largest share of searches coming in from out-of-town.
Metros that are seeing a high share of outbound searches leaving the metro, but a low share of inbound searches coming from other markets may be at risk of losing renters. Conversely, when a high share of searches are coming from other parts of the county but few existing residents are looking to leave, a market is likely to be fast-growing. Still other metros exhibit both a high volume of outbound searches to other parts of the country, and as well as a high volume of inbound searches from other parts of the country, indicating that the market is popular, but experiencing high turnover.
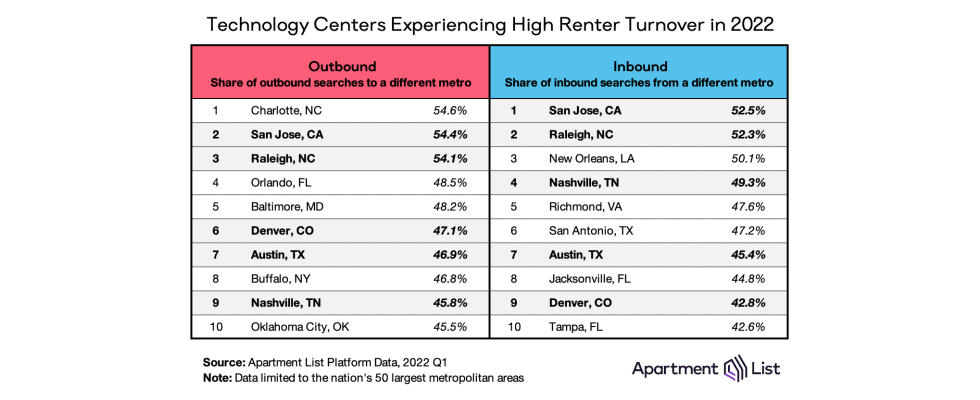
As we emerge from the pandemic, five metros are behaving like revolving doors and show up in both lists: San Jose CA, Raleigh NC, Denver CO, Austin TX, and Nashville TN. All five benefit from technology-driven economies that offer relatively high wages, but also struggle with relatively expensive housing markets. San Jose and Raleigh in particular are the only two major metros where more than half of all searches, inbound and outbound, cross metropolitan lines. In San Jose the majority of search activity remains within state lines, highlighting the migration flows that exist between the nearby San Francisco and Sacramento metros, as well as Los Angeles to the South. Raleigh shares a lot of search activity with nearby Charlotte and Durham, but also received a sizable share of interest from Atlanta GA. As new renters are drawn to these tech hubs by strong job opportunities, existing residents risk being priced out by rising housing costs.
Other Notable Migration Trends:
For New Yorkers looking to leave the Big Apple, Miami is the top destination. “Snowbird” migration was strong during the winter of 2022. Among users looking to leave metropolitan New York, 6 percent searched in Miami, compared to 5 percent in nearby Philadelphia and 4 percent in Boston and DC. Florida is by far the most popular state for these New Yorkers, having received twice as many search interests as any other state. This is a major contributing factor to why rents have risen faster in Florida than any other state over the past two years.
Los Angeles renters supply the majority of rental demand in nearby markets. Los Angeles is the #1 source for inbound search traffic into each of the following Southern California metropolitan areas: Riverside (Angelenos account for 67 percent of all cross-metro searches), Oxnard (60 percent), Santa Maria (29 percent), and San Diego (25 percent). LA’s reach even extends into other states, supplying 18 percent of searches into Las Vegas and 13 percent of searches in Phoenix. As LA renters spread out in search of more-affordable housing, these Southwestern states are a perfect example of how housing demand in one region can quickly spill over into neighboring communities.
Chicago’s broad appeal is attracting renters from across the country. Proximity is a dominant factor for explaining the search patterns in and out of a city. For example, the major Texas cities supply the majority of search activity for one another, as do many cities in Florida and California. But renters looking for apartments in Chicago are coming from all across the United States; in fact, they came from over 500 distinct metros. And no one metro supplied more than 3.8 percent of inbound searches to Chicago.
Tampa’s rapid growth is driven largely by in-state renters. Since the start of the pandemic in March 2020, the median rent in the Tampa metro has increased by 39 percent, the fastest rent growth among all large metros in the country. Notably, much of this surge in demand seems to be coming from renters who are already living in Florida – Orlando and Miami are the top two sources of inbound searches to Tampa, and three other Florida metros (North Port, Lakeland, and Jacksonville) are among the top 10. In contrast, in the Phoenix metro, which ranks fourth in rent growth since the start of the pandemic, only one of the 10 most common inbound search locations is in-state (Tucson).
Complete metro- and state-level migration data
For access to granular data, the tables below offer summaries for over 100 metropolitan areas and all 50 states.
Metro-Level Migration Data
| Metro | Outbound Share (1) | Top Outbound Location (2) | Inbound Share (3) | Top Inbound Location (4) |
|---|---|---|---|---|
| Akron, OH | 45.6% | Cleveland, OH | 46.7% | Cleveland, OH |
| Albany, NY | 46.2% | New York, NY | 33.9% | New York, NY |
| Albuquerque, NM | 23.0% | Phoenix, AZ | 39.4% | Las Vegas, NV |
| Allentown, PA | 44.8% | Philadelphia, PA | 50.4% | Philadelphia, PA |
| Ann Arbor, MI | 74.8% | Detroit, MI | 52.6% | Detroit, MI |
| Atlanta, GA | 44.5% | Nashville, TN | 28.1% | New York, NY |
| Austin, TX | 46.9% | San Antonio, TX | 45.4% | Houston, TX |
| Baltimore, MD | 48.2% | Washington, DC | 37.7% | Washington, DC |
| Baton Rouge, LA | 31.5% | New Orleans, LA | 51.6% | Dallas, TX |
| Birmingham, AL | 36.7% | Huntsville, AL | 39.4% | Atlanta, GA |
Table notes:
- The share of searches from the metro (ie. outbound searches) that are destined for apartments outside the metro.
- Among outbound searches leaving the metro, the most popular destination.
- The share of searches into the metro (ie. inbound searches) that originated from users who lives outside the metro.
- Among inbound searches into the metro, the most popular source location.
State-Level Migration Data
| State | Outbound Share (1) | Top Outbound Location (2) | Inbound Share (3) | Top Inbound Location (4) |
|---|---|---|---|---|
| Alabama | 32.2% | Georgia | 32.1% | Georgia |
| Alaska | 27.9% | Washington | 53.1% | Washington |
| Arizona | 18.8% | California | 32.5% | California |
| Arkansas | 34.6% | Texas | 42.0% | Texas |
| California | 16.2% | Arizona | 15.9% | Texas |
| Colorado | 30.9% | California | 37.1% | Texas |
| Connecticut | 28.2% | Massachusetts | 28.1% | New York |
| Delaware | 41.3% | Pennsylvania | 50.6% | Pennsylvania |
| District of Columbia | 70.8% | Maryland | 65.3% | Maryland |
| Florida | 15.6% | Texas | 25.3% | New York |
Table notes:
- The share of searches from the metro (ie. outbound searches) that are destined for apartments outside the metro.
- Among outbound searches leaving the metro, the most popular destination.
- The share of searches into the metro (ie. inbound searches) that originated from users who lives outside the metro.
- Among inbound searches into the metro, the most popular source location.
Share this Article