Sun Belt metros lead apartment construction boom in 2023

Introduction
After a year and a half of record-setting rent growth, the past six months have brought a rapid cooldown in the rental market. And even if demand begins to bounce back this year, it remains likely that rent growth in 2023 will be modest at best. That’s because there are currently a record number of new apartment units under construction, and this influx of new supply should keep prices in check. While encouraging, this recent construction boom does not change the fact that the nation is currently in the midst of a broad housing affordability crisis that has built up over many years. And even as multifamily construction remains hot, the construction of new single-family homes has recently begun to sputter.
Over the long run, it is crucial that enough new housing supply is constructed to keep pace with population growth and rising demand. Over the past decade, many of the nation’s large coastal markets – including New York City, Boston, San Francisco, and Los Angeles – have not built nearly enough new housing to keep pace with local job growth, resulting in deep housing affordability crises. In contrast, Sun Belt markets throughout Texas, Arizona and Florida have experienced rapid growth in both jobs and housing. In this report, we dive into decades of building permits data collected by the U.S. Census Bureau to put the latest data into a historical context and to evaluate how these trends have varied regionally.
Multifamily permitting continued to boom in 2022, even as single-family began to stall out
The total number of housing units permitted for construction across the U.S. fell slightly last year, from 1.74 million in 2021 to 1.65 million in 2022, marking the first year that this figure has declined since 2009. The total number of building permits issued in 2022 was still higher than in any year from 2007 to 2020, but it continues to lag the peaks seen in the runup of the 2000s housing bubble.
Breaking down the overall figure between single-family and multifamily construction shows that these two segments of the housing market have been on notably different trajectories. The overall dip from 2021 to 2022 was driven by a 13 percent decline in the number of building permits issued for new single-family homes, as rapidly increasing mortgage rates tempered demand in the for-sale market. In contrast, the number of new multi-family units permitted continued to climb, jumping by 9 percent last year.
Since the late-2000s housing market collapse, multifamily construction has recovered significantly faster than single-family construction. The number of single-family permits issued in 2022 remained 42 percent below the 2005 peak. Meanwhile, the number of multifamily units permitted last year was 44 percent greater than the 2005 level, and represented the highest level of activity since 1986. Multifamily accounted for 41 percent of all housing units permitted in 2022, the highest share since 1985. And from 2010 to 2022, multifamily has comprised 37 percent of all housing units permitted, up sharply from an average of 24 percent from 1990 to 2009.
At the same time, multifamily development projects have been growing in size. From 1990 to 2009, 18 percent of multifamily units permitted were in buildings with two to four units; from 2010 to 2022, this type of “missing middle” housing accounted for just 8 percent of multifamily building permits. And among buildings with five units or more, the average size has spiked by 72 percent over the same span, from an average of 16 units over the course to 1990 to 2009 to an average of 27 units from 2010 to 2022.
Austin has been building at the fastest pace among all large metros for six years straight
The pipeline of new construction varies widely across markets. To compare permitting activity across different parts of the country, we calculate a per-capita measure – specifically, how many new housing units are permitted in each year in a given metropolitan area per 1,000 existing residents of that metro. The chart below plots this permits-per-capita metric from 1990 to 2022 for each of the 30 largest metro areas in the county.
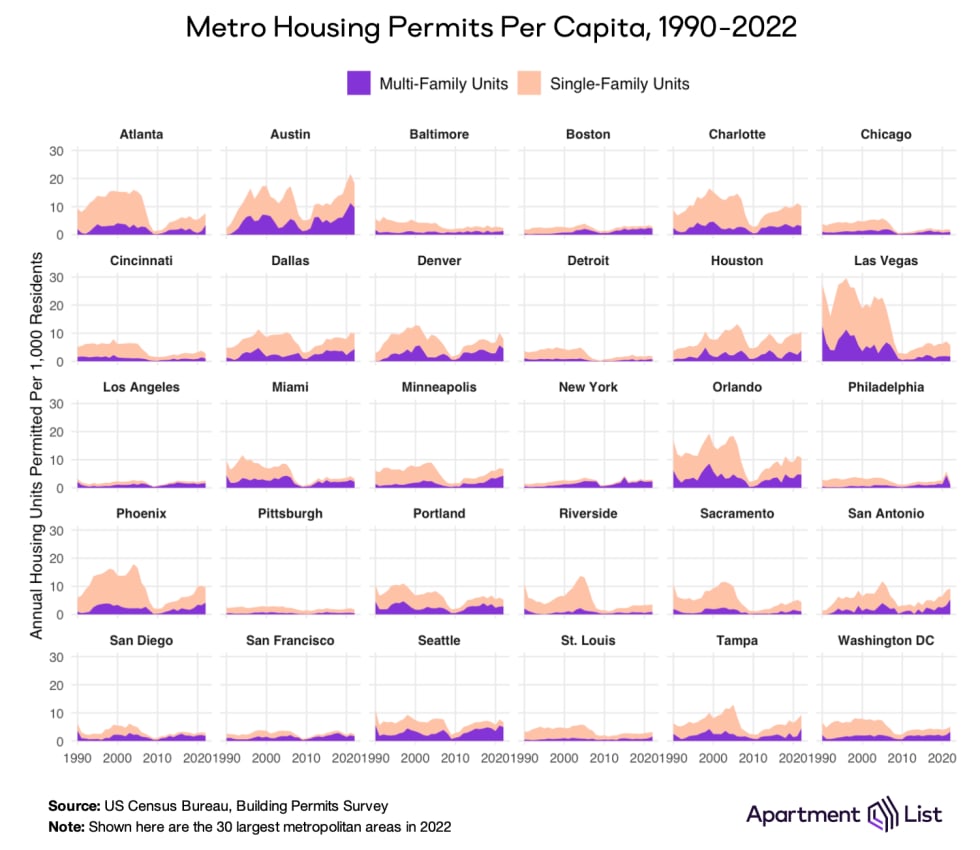
(See this interactive chart for a more detailed look at the localized trends in each of the nation’s 50 largest metros)
Looking at the trends for these markets side-by-side, we can see the wide variation in both the relative levels of building activity and in their trends over time. A number of distinct patterns emerge:
- Some markets that were overbuilding in the runup to the Great Recession experienced sharp collapses from which they have been slow to recover. Las Vegas epitomizes this trend, but markets such as Atlanta and Riverside follow a similar trajectory.
- Markets such as Austin and Charlotte – and to a lesser extent Houston, Dallas, and Denver – have been building rapidly for decades, both before and after the Great Recession.
- The nation’s most expensive markets – e.g. New York City, Boston, San Francisco, and Los Angeles – demonstrate clearly how they got that way. Namely, by building new housing at extremely low levels for decades, in spite of booming demand.
- We also see low levels of construction in many Midwestern and Rust Belt metros, such as Detroit, Chicago, Pittsburgh, and St. Louis. But in contrast to the coastal markets listed above, slow construction here has largely been a rational response to stagnant economic growth.
To see more clearly the relative ranking of permitting activity by market over time, the following chart sorts the nation’s 50 largest metros from highest to lowest per-capita rates. This interactive tool defaults to showing the most recent 2022 figures, but also includes a toggle with data for each individual year going back to 1990.
Austin ranked number one in 2022, with 18.3 new units permitted per 1,000 residents, more than triple the average rate across the 50 largest metros as a whole (5.2). The top five was rounded out by Raleigh (14.9 permits-per-capita), Jacksonville (14.1), Orlando (10.7), and Houston (10.5). As noted above, the construction boom in Austin has been long-lasting. Austin has now topped the ranking of per-capita permitting activity for six straight years, and has been among the top three in every year since 2006.
While Austin’s current boom is certainly historic, it is not unprecedented if we look further back. Las Vegas had the highest rate of per-capita permitting in every year from 1990 to 2006, and in all but one of those years, it was building at a faster pace than Austin’s 2022 rate. Activity in Las Vegas peaked in 1996, when the metro permitted 29.6 new units per-capita, far outpacing the rate of any other metro (Austin ranked #2 that year, but with a per-capita permitting rate that was just 56 percent that of Las Vegas).
But just as it led the way during the housing boom, Las Vegas also experienced the nation’s most severe bust when the bubble burst. Permitting activity in Las Vegas fell off a cliff in the late 2000s, bottoming out in 2011 with the total number of permits issued that year representing just 13 percent of the peak number issued in 2005. Construction there has gradually picked back up, but the number of permits issued in 2022 was still just 33 percent of the 2005 level.
Visualizing three decades of building activity
Las Vegas offers the starkest example of the boom and bust whiplash of construction activity that occurred in the years surrounding the Great Recession, but the same general pattern can be seen in many parts of the country. This is evident in the following animated map, which plots annual permits-per-capita at the county level for the entire U.S. from 1990 to 2022.
Throughout the 1990s and the first half of the 2000s, the animation shows how permitting activity gradually picked up steam across the country, but especially in the South and the Mountain West. Florida, in particular, emerged as a clear hot spot – Orlando ranked in the top 10 for fastest permitting among the 50 largest metros in every year from 1990 to 2010, while Jacksonville climbed the ranks from #15 in 1998 to #2 in 2005. At the same time, there was also rapid growth throughout Georgia and along the coasts of the Carolinas. Further west, the rapid boom in Las Vegas was mirrored in many parts of Utah and throughout Colorado. Boise – which does not rank among the 50 largest metros plotted in the bar chart above – was also a notable hot spot during this period.
But note that even during the 2005 permitting peak, activity was still subdued in many parts of the country. In much of the middle part of the country, demand for new housing simply wasn’t surging in the same way that it was throughout much of the Sun Belt. But activity was also muted throughout the Northeast, even as demand was strong. And while some parts of inland California were building at a fast clip, coastal California was continuing to underbuild even during this historic nationwide boom.
As the bubble collapsed, permitting activity ground to a halt, with the total number of permits issued nationwide falling by 72 percent from the 2005 peak to the 2010 trough. This rapid slowdown occurred virtually everywhere in the nation. But after this point, we can see the gradual recovery of the past decade, during which a new set of hot spots emerged. One of the first areas where activity spiked was actually in North Dakota, where the oil boom around this time drove a corresponding boom in the region’s housing market. By 2022, we see that activity has been booming in the major markets of Texas, statewide throughout Florida, and in much of Utah and Colorado.
Dense construction in the core city is making up a greater share of new construction in many markets
In addition to the wide variation in construction activity across different parts of the country, we also find interesting trends in where construction has been occurring within the nation’s major metropolitan areas. Much of the early 2000s boom was driven by suburban single-family construction, and while that type of development still makes up a majority of new construction, there has been a notable shift toward denser multifamily construction in the core cities of many metros over the past decade. Across the nation’s 50 largest metros as a whole, there is a clear trend, on average, of core cities accounting for a greater share of new permitting since the Great Recession. From 1990 to 2009, 20 percent of all permits issued in the top 50 metros were in the core cities of those metros; from 2010 to 2022, that share has jumped to 29 percent.1
This is particularly true in the many of the nation’s pricey coastal cities. For example, Boston-proper accounted for just 6 percent of metro-wide permits issued from 1990 to 2009, but from 2010 to 2022, 24 percent of all new units permitted in the Boston metro were in the core city, a fourfold increase. In the Washington, D.C. metro, the share of permits coming from the core city spiked from an average of 3 percent from 1990 to 2009 to an average of 20 percent from 2010 to 2022. Similar trends can be seen in markets such as Denver, Seattle, and Los Angeles.
However, this is not the case across the board. In particular, many of the fastest growing Sun Belt markets buck this trend. For example, in Austin, Houston, and Phoenix, the share of metro-wide permits coming from the core city has been roughly flat when comparing the periods before and after the Great Recession. And in some markets, such as Raleigh and Jacksonville, a greater share of permitting activity has been happening in the suburbs over the past decade.
Dense, transit-oriented development can make our nation’s cities more vibrant and liveable, and is also crucial for meeting climate goals. Unfortunately, although there has been something of a shift toward this type of development, it has so far been primarily relegated to large expensive metros that still aren’t building enough to keep pace with growth overall. Meanwhile in the markets that are building rapidly to enable growth, much of the new development continues to be in the sprawling suburbs.
Conclusion
The U.S. is currently in the throes of an ongoing housing affordability crisis, which has only grown more acute in the face of disruption caused by the pandemic. Increasing the nation’s housing supply is crucial to relieving the pressure of this crisis. While permitting activity for new multifamily housing units is currently stronger than it has been in decades, single-family construction continues to lag, keeping homeownership out of reach for many younger Americans looking for a starter home. And while many Sun Belt markets are doing a decent job of building enough new housing to keep pace with growth, the nation’s most expensive markets are continuing to severely underbuild. An influx of new multifamily supply should keep rent growth in check in 2023, but the longer-term national picture is still characterized by shortage.
- For the purposes of this analysis, each metro has a single “core city,” which is defined as the metro’s largest city by population.↩
Share this Article